Understand the event’s environmental impact, and how NZero provided Tour de Luxembourg the information needed to inform future decarbonization efforts and show leadership in the decarbonization of sports events globally.
This year marked the second year NZero partnered with the Tour de Luxembourg to measure the event’s Greenhouse Gas (GHG) emissions, which we tracked using data from vendors, event organizers, and participating teams during the 5-day event.
All told, total emissions for this year’s Tour de Luxembourg were 165 metric tons of carbon dioxide equivalent (MTCO2e), equal to flying 761,484 miles, or, one person flying around the world 30 times. Compared to last year’s event, there was an 81% emissions increase, due mainly to a substantial improvement in the data coverage, meaning that in 2023 there was more accurate data obtained to make the calculations.
This year, 19 out of 20 teams participated in our tracking efforts, a substantial 46% improvement from the previous year. On the vendor side, 12 vendors provided primary data (up from 5 in 2022). The increase in the voluntary disclosure of activity data enabled NZero to craft a more accurate picture of the event’s environmental impact, increasing awareness of emissions and providing the Tour de Luxembourg the information needed to inform future decarbonization efforts and show leadership in the decarbonization of sports events globally.
2022 vs 2023
The increase year over year is due to a higher participation rate in the data collection surveys, meaning fewer estimates were used compared to last year. Greater participation from international teams also meant that many teams’ air travel significantly contributed to the increase in emissions.
That said, Scope 1 & 2 emissions decreased 24% and 15% respectively compared to 2022, while Scope 3 emissions,which made up 87% of total emissions in 2023, increased by 127% versus 2022.
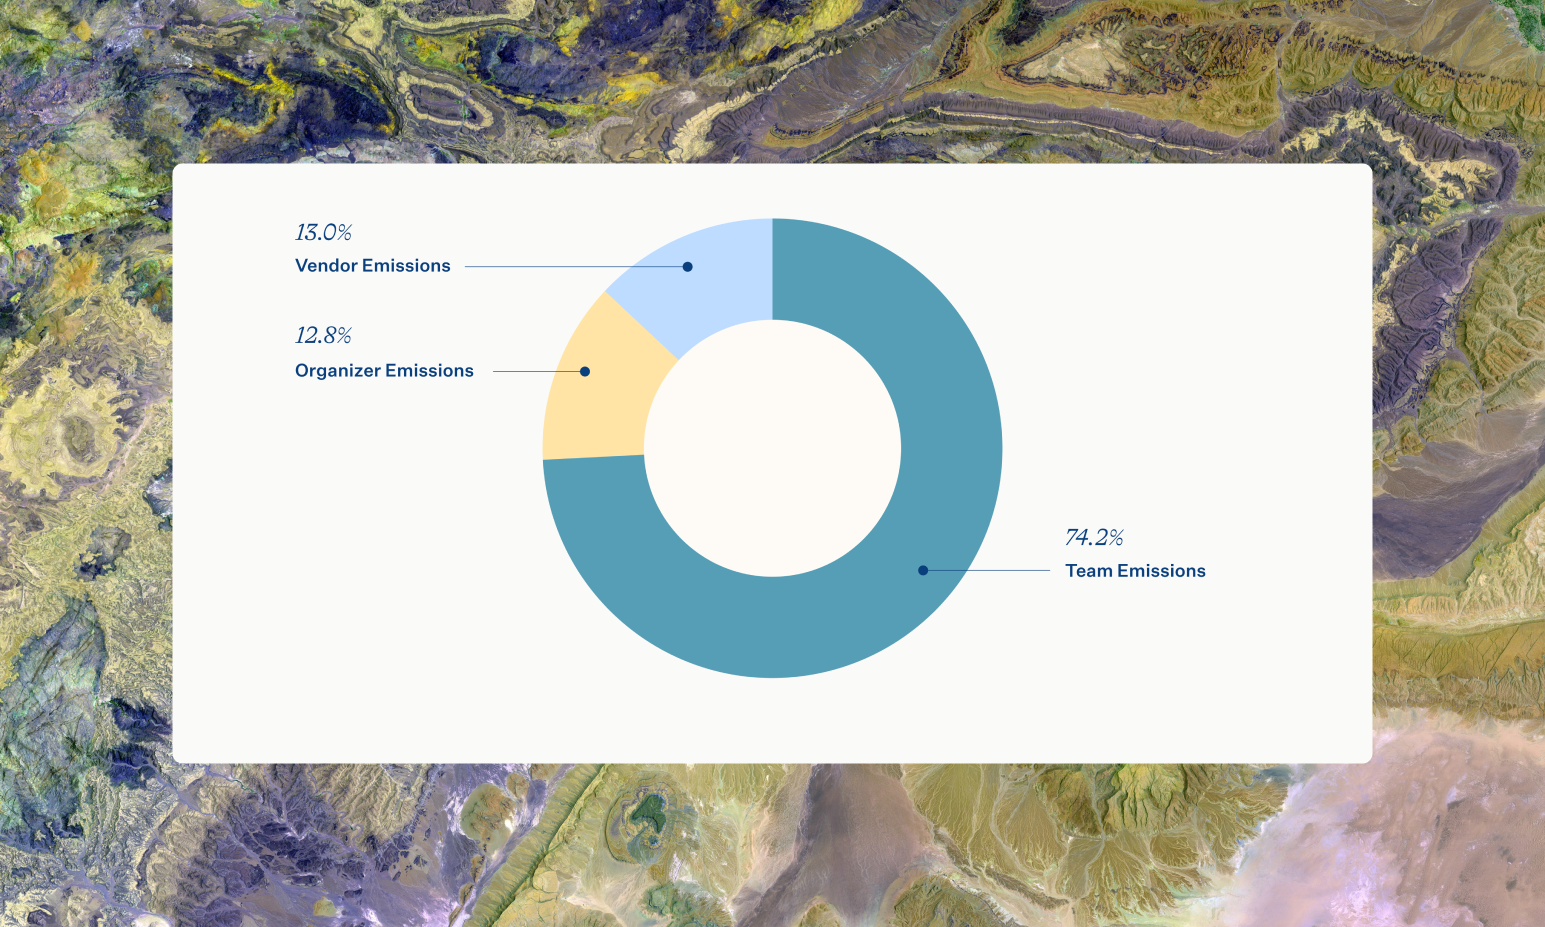
Top Emissions Sources
Participating teams were the dominant carbon contributors, generating nearly 75% of the total emissions, 95% of which are related to travel to and from the event, as well as transportation during the race. This means that over 70% of the total event emissions were attributed to team transportation alone.
Aside from teams, event organizers and vendors contributed 42.5 MTCO2e, over 90% of these emissions, from traveling.
Tour de Luxembourg emissions breakdown (MTCO2e)
Transportation,whether traveling to or from the event, or around during the event, made up nearly 94% of total event emissions. Air travel accounted for 54% of event emissions alone, and helicopters, which only comprised 1% of total distance traveled during the event, made up nearly 5% of total event emissions, highlighting the high carbon intensity of jet fuel.
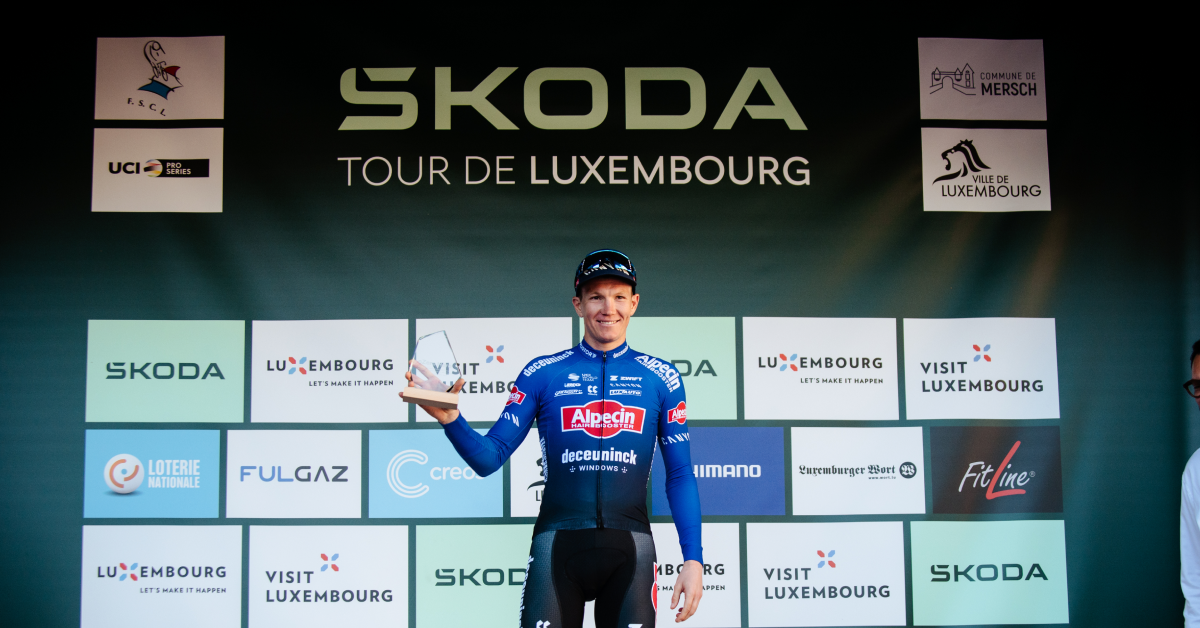
NZero Hero Award
Alpecin-Deceuninck had the lowest emissions and was the winner of the 2023 NZero Hero award. Their transportation strategy was what set them apart from the rest of the teams: 50% of their travel was by bus and 27% by train, both of which have a much lower carbon intensity than flying.
Additional Highlights
Plane travel accounted for 90% of both inbound and outbound kilometers traveled and emissions associated. Last year only 25% of kilometers traveled and 31% of travel emissions were associated with plane travel. This year’s increase is mainly due to new international teams traveling far distances.
Travel to and from the event was the greatest contributor to emissions, making up over 63% of total event emissions. Transport during the event was the second largest contributor at just over 30%. Combined, inbound and outbound travel and travel during the event made up over 93% of the total event emissions, with hotel accommodations (4%), electricity usage (2%), and waste (<1%) making up the last 7% of event emissions.
Hotel emissions decreased by 3 MTCO2e, due to a reduction in the average number of rooms booked per team. The 2022 average was 10 rooms per team, while 2023 average was 8 rooms per team.
Opportunities For Decarbonization
Film Race With Drones Versus Helicopters
Using drones as opposed to helicopters to film the race could help avoid over 5 MTCO2e, 20% of all vendor emissions. While there are regulations around the use of drones, drone operators could potentially seek to obtain a permit from the DAC (Direction de l’Aviation Civile) to fly their UAVs (Unmanned Aerial Vehicles), by providing a risk assessment and proof of insurance coverage.
Switch From Jet Fuel To Sustainable Aviation Fuel
A lower-carbon alternative to jet fuel is sustainable aviation fuel (SAF), which when blended with jet fuel can be used to replace pure jet fuel and reduce emissions. Had SAF been used during the event, emissions from helicopters would have decreased by 28%, and emissions from travel during the event overall would have seen a decrease of 11%.
Adjust Transportation And Room Bookings
Teams and vendors can reduce the emissions associated with hotel stays by booking more double rooms over single rooms.
A combined total of 17.3 MTCO2e (a 10.5% overall reduction) could have been avoided had:
All teams stayed at Parc Hotel – an ecolabel hotel located close to the event stages
All teams replaced their cars and motorcycles with electric vehicles for inbound and outbound travel as well as transportation during the event
All vendors replaced their cars used for inbound and outbound travel as well as cars used during the event with electric vehicles
All teams traveled to and from the event via train rather than airplane for any flights less than 300 kilometers
For sustainability leaders, by
sustainability leaders.