
Energy Strategy for the Next Era of Industrial Real Estate
Expert Advice
Mar 3, 2026

Electricity costs for commercial and industrial organizations are often more complex than they first appear. While many executives focus on total energy consumption measured in kilowatt hours, a significant portion of monthly electricity expenses is frequently driven by a different metric: peak demand. In competitive manufacturing, logistics, real estate, and data intensive operations, understanding peak demand is essential for cost control, budgeting accuracy, and operational stability. A single short interval of high electricity use can influence an entire month of charges, making peak demand one of the most financially important yet misunderstood components of utility billing.
Peak demand refers to the highest average level of electrical power, measured in kilowatts, that a facility draws from the grid during a specified interval within a billing cycle. Most utilities measure demand in 15 minute or 30 minute intervals. At the end of each billing period, the highest recorded interval becomes the billing demand for that month.
It is important to distinguish between kilowatts and kilowatt hours.
| Metric | What It Measures | Example |
|---|---|---|
| Kilowatts (kW) | Instantaneous power demand at a specific moment | 2,000 kW recorded at 2:15 PM |
| Kilowatt hours (kWh) | Total electricity consumed over time | 500,000 kWh used during a month |
A facility may use 500,000 kilowatt hours in a month, but if at one point it draws 2,000 kilowatts during a 15 minute interval, that 2,000 kilowatt level may determine the demand charge applied to the bill.
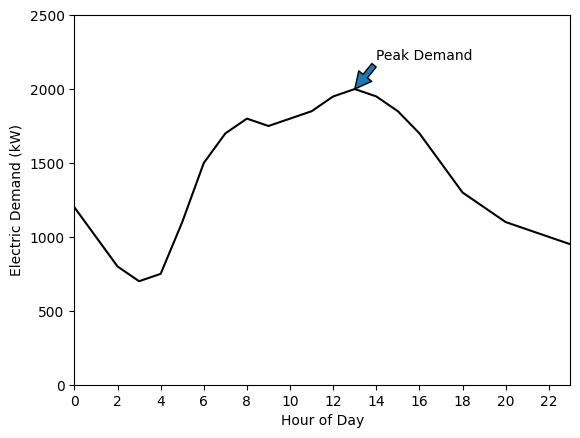
A load curve graph typically illustrates this dynamic clearly. The horizontal axis represents time over a 24 hour period, while the vertical axis represents power demand in kilowatts. Even if demand remains relatively stable for most of the day, one sharp spike caused by simultaneous equipment startup or HVAC activation can set the billing peak. Utilities size their infrastructure to meet these peaks, which is why demand charges are structured around the highest observed load rather than average usage.
In some tariffs, additional demand related terms may apply:
Under ratchet structures, one unusually high spike can influence costs well beyond a single billing cycle.
Commercial and industrial electricity bills typically consist of two primary components: energy charges and demand charges. Energy charges are calculated by multiplying total kilowatt hours consumed by a per kilowatt hour rate. Demand charges are calculated by multiplying the billing peak demand in kilowatts by a per kilowatt demand rate.
Consider a simplified example of a monthly electricity bill:
Energy Charges
500,000 kWh × $0.08 per kWh = $40,000
Demand Charges
2,000 kW × $20 per kW = $40,000
Total Electricity Cost
$80,000
In this scenario, demand charges represent 50 percent of the total bill.
In many regions, demand charges account for 30 to 70 percent of large commercial electricity bills. Seasonal variations may further increase rates during summer months when system wide loads are higher. Some utilities apply time of use demand charges, which impose higher costs during predefined peak windows such as weekday afternoons.
Because demand charges are based on a single highest interval, they introduce a structural asymmetry into cost management. A facility may operate efficiently for most of the month, yet one brief operational surge can significantly increase total expenses. Without interval level visibility into load patterns, organizations often discover these cost drivers only after receiving the monthly invoice.
Peak demand spikes are typically driven by short duration operational synchronization rather than sustained overconsumption.
Common operational causes include:
Electrification and operational modernization can further concentrate load within narrow time windows.
Portfolio level factors may include:
For organizations managing multiple facilities, the challenge expands. Each site may operate under different schedules, climates, and tariff structures. Without centralized data aggregation, it becomes difficult to identify which facility is driving the highest demand costs or whether spikes are operational anomalies or predictable patterns. Monthly PDF invoices provide only summary level information and do not reveal the underlying interval behavior that determines billing demand.
Managing peak demand requires a combination of operational discipline, data transparency, and financial planning. At the operational level, facilities can stagger equipment startup schedules to avoid simultaneous load surges. Sequencing high draw machinery in intervals separated by several minutes can reduce the highest recorded demand. In office and retail environments, optimizing HVAC scheduling and setpoints during known peak windows can mitigate spikes.
Data visibility is central to these strategies. Access to interval demand data allows energy managers to monitor real time or near real time load profiles and set internal thresholds. When demand approaches a predefined limit, alerts can trigger temporary load adjustments. Historical interval data also enables benchmarking across facilities, helping organizations identify sites with unusually high peaks relative to square footage, production output, or operating hours.
Financially, understanding demand patterns supports more accurate budgeting and tariff evaluation. Some utilities offer alternative rate structures that may be advantageous depending on load shape characteristics. Evaluating contract demand levels can prevent overpaying for reserved capacity. For organizations with volatile production cycles, forecasting models based on historical interval data can improve cash flow predictability and reduce unexpected cost variance.
Peak demand is one of the most influential variables in commercial and industrial electricity pricing. While total energy consumption remains important, the highest recorded interval of power use during a billing cycle often determines a substantial portion of monthly costs. Short duration operational decisions can therefore have disproportionate financial consequences.
Organizations that rely solely on aggregated monthly consumption data operate with limited visibility into this risk. By analyzing interval level demand patterns, aligning operational scheduling with load management strategies, and evaluating tariff structures proactively, enterprises can improve cost control and enhance budget stability. As facilities become more electrically intensive and operational complexity increases, understanding peak demand becomes a foundational element of effective energy management.