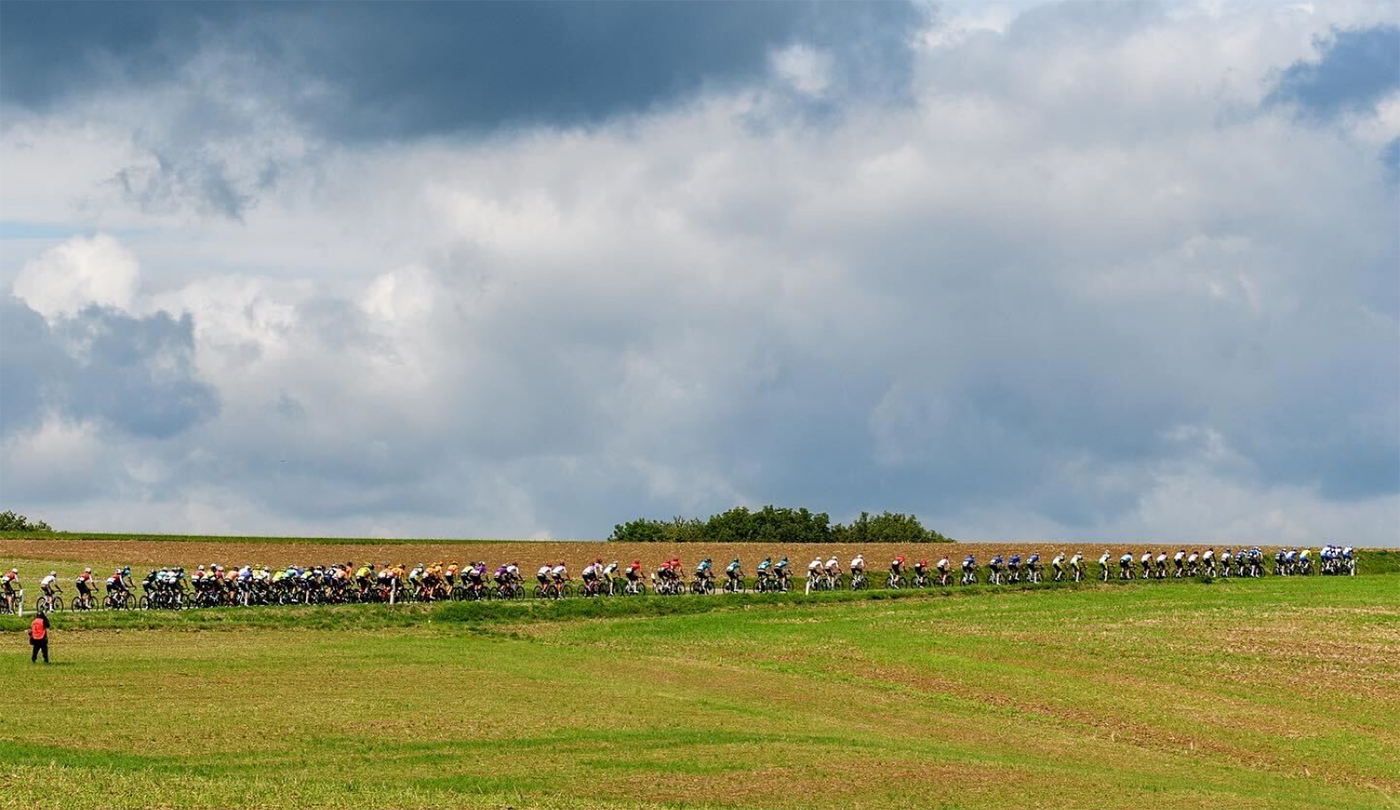
We partnered with Škoda Tour Luxembourg to track the carbon cost of their 2022 event. For five days, we captured the emissions impact of the race across all three scopes, gathering data via meters and questionnaires completed by the event organization, its vendors and the pro-cycling teams.
We often think about cycling as a sustainable activity or mode of transportation. However, what about the popular pro-cycling events themselves? There are many factors involved in the planning and execution of these large-scale cycling events that can have unseen – and unrealized – environmental impacts
At NZero, we had the honor of partnering with Škoda Tour Luxembourg to track the carbon cost of their 2022 event. For five days, we captured the emissions impact of the race across all three scopes, gathering data via meters and questionnaires completed by the event organization, its vendors, and the pro-cycling teams. In the spirit of friendly competition, one pro-cycling team was awarded the NZero Hero award for the lowest carbon impact.
From tracking and analyzing all this data, we uncovered some fascinating findings – all of which help identify decarbonization opportunities for future cycling events.
Top Emissions Sources
After tracking emissions across cycling teams, suppliers, and vendors, we discovered that the total GHG emissions for the 5-day event was 91.1 MT CO2e, which is equivalent to driving about 226,000 miles in a passenger car, or 9 trips around the world!*
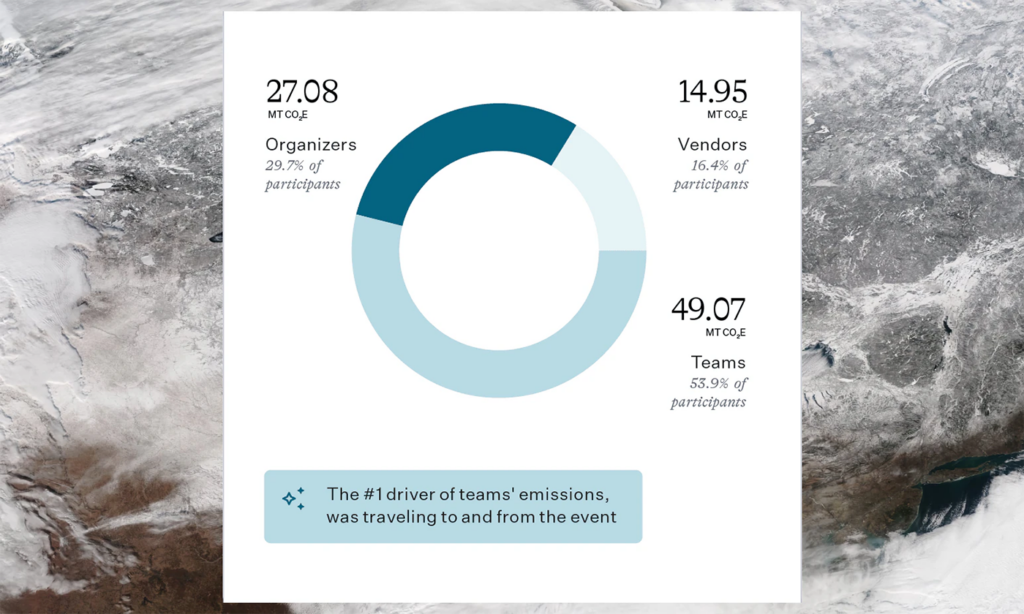
Total Škoda Tour Luxembourg GHG Emission Breakdown (MT CO2e)
“There can be no progress without first measuring the level at which you’re currently operating, and that’s the step we took with the race this year. NZero helped us track carbon emissions and our other eco-minded efforts and optimize race operations so that both the race organization and the cycling teams can work towards a more sustainable future.”
Andy Schleck Race Director for the Škoda Tour Luxembourg
Transportation Impact
One of the key findings in our analysis was the enormous impact of transportation. Almost a third (32%) of the total emissions for the event was driven by the teams traveling to and from the event. While the train contributed 13% to the total team travel, it surprisingly accounted for only 0.37% of the total team travel emissions. While we expected rail to have a significantly lower carbon impact than carbon-intensive modes of transportation, such as flying, the magnitude of carbon savings surprised even us.
The UCI Pro Team Arkéa-Samsic (FR) was awarded the NZero Hero award for the lowest carbon emission! The team had 61% of its travel to and from the event by train, which enabled them to reduce their total emissions significantly.
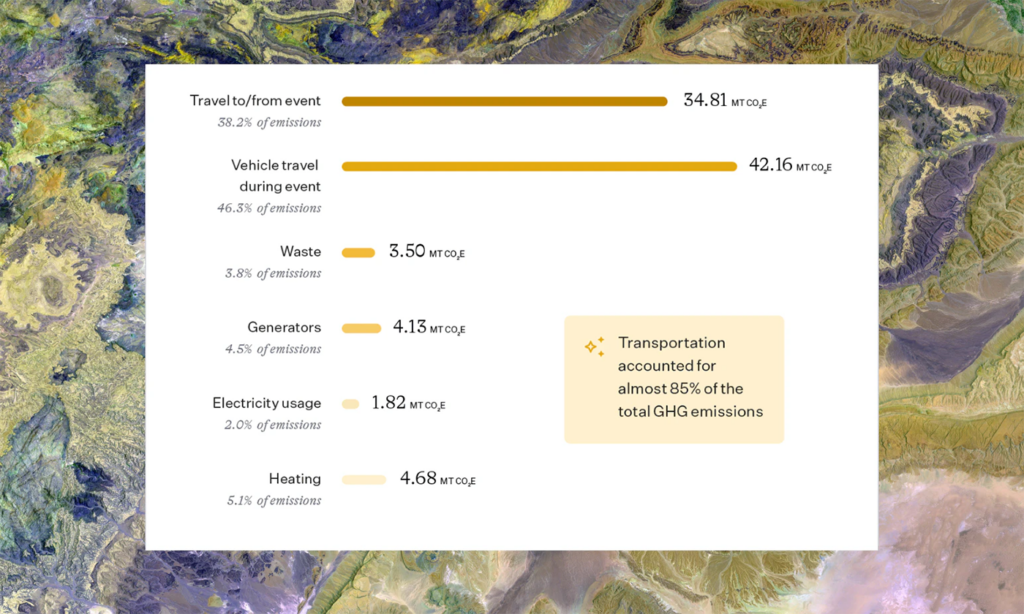
After estimating the travel impacts of vendors with the participating teams, and including GHG emissions generated during the event from all vehicles across race support, broadcasting, freighting goods, and more, transportation rises to about 85% of the total event GHG emissions.
Transportation emission breakdown during the event (MT CO2e)
Key Learnings
The extensive analysis and data captured at the event allowed us to deeply understand operational impacts. Here are some additional learnings and decarbonization opportunities for future events:
Transitioning all event passenger cars to electric vehicles would have reduced their emissions by 58.4% and avoided 10 MT CO2e.**
Transitioning to drone technology (for broadcasting) would not only drive even more substantial GHG emissions reductions, but it would also considerably reduce the costs.
If generators were using biodiesel, 4 MT CO2e could be avoided, representing 93.8% emission reduction coming from the generators.
The VIP catering vendors proactively managed their climate impact by sourcing 70% of its products locally and 50% of its menu was sustainably-sourced.
If the catering vendor offered 15% more chicken dishes instead of the same percentage of beef dishes, they would save 6.6 MT CO2e, or 33% of the 19.9 MT CO2e of the total food-related emissions.
Interested in tracking your next event? Contact us to learn more from our team of experts on how you can make your event more sustainable!
Footnotes
* This figure includes emissions from the event organization, its vendors and the cycling teams along with the emissions associated with traveling to and from the event. GHG emissions from spectators traveling to the event were not included in NZero calculations.
** Calculations include Lifecycle emissions of both electric and conventional fuel vehicles
For sustainability leaders, by
sustainability leaders.