NZero was founded on the belief that the right data can free us to think and act boldly on climate. It has guided and empowered our customers on their sustainability journey, aiding in the establishment of GHG emission baselines, the commitment to emission reduction targets and the formulation of decarbonization roadmaps. It is also a driving force behind our own daily operations and work ethos. It’s why we measure and publish our own GHG inventory.
Our Approach
We prioritized a comprehensive examination of our emission sources across all three Scopes, ensuring a detailed collection of reliable data for each category.
As a semi-distributed, semi-remote software company, our workforce is dispersed across the United States. This geographical distribution results in minimal direct Scope 1 and 2 emissions, while the majority of our overall greenhouse gas emissions arise from indirect, value chain Scope 3 emissions.
Our GHG inventory included emissions from January 1, 2023 to December 31, 2023 from NZero employees, contractors and interns that worked at the company during that time. After a thorough review of our operations we identified material emissions to be:
Scope 1 emissions from natural gas
Scope 2 emissions from purchased electricity
Scope 3, across four categories, including Purchased Goods and Services, Waste Generated in Operations, Business Travel and Employee Commuting including work from home (WFH) emissions
A variety of different data collection methods were deployed. We gathered data from utility bills, utilized expense reports and tracked how much waste was generated at our office. The global trend of remote work has surged in response to the COVID-19 pandemic, with a growing number of employees working from home since 2020. This shift has led to reduced energy consumption in commercial and industrial spaces, accompanied by an increase in residential energy use. With this transition, emission sources have shifted from office spaces to employee homes. These emissions can often be difficult to calculate as residential energy use can vary based on a number of different variables including location, weather, number of occupants, type and size of residence, its age and lighting type, among numerous others. With so many variables in play, and employee privacy laws often posing an issue for data collection, these emissions are particularly difficult to estimate and are often forgotten about or intentionally left out of in most GHG inventories.
To understand and accurately capture the hybrid and fully remote employee GHG emissions contributions, we deployed a tailored employee survey. We defined a marginal energy usage attributable to the counterfactual presence of each employee in their residence, and developed a geographically-aware gradient-boosted regression tree model that operates on an hourly basis utilizing the ResStock TMY3 2022 dataset. Inputs for the regression model were gathered via the survey to identify key residential features, number of occupants in the residence during work hours, as well as commuting frequency and modes of transportation when applicable. This employee survey also enabled us to collect data on waste generation during working hours. This approach enabled the estimation of individual Scope 3 emissions for the year 2023, incorporating both hourly local weather data and carbon intensities from NZero’s platform.
For calculations, activity-based emission factors were used wherever possible, while spend-based factors were used when no activity data was available. All calculations were done in compliance with the methodologies outlined in the GHG Protocol. NZero uses the most recent IPCC Fifth Assessment Report global warming potential (GWP) values when calculating carbon emissions. Calculation methodologies for each Scope can be found in the Methodology and Emission Factors section at the end.
2023 NZero GHG Emission Inventory
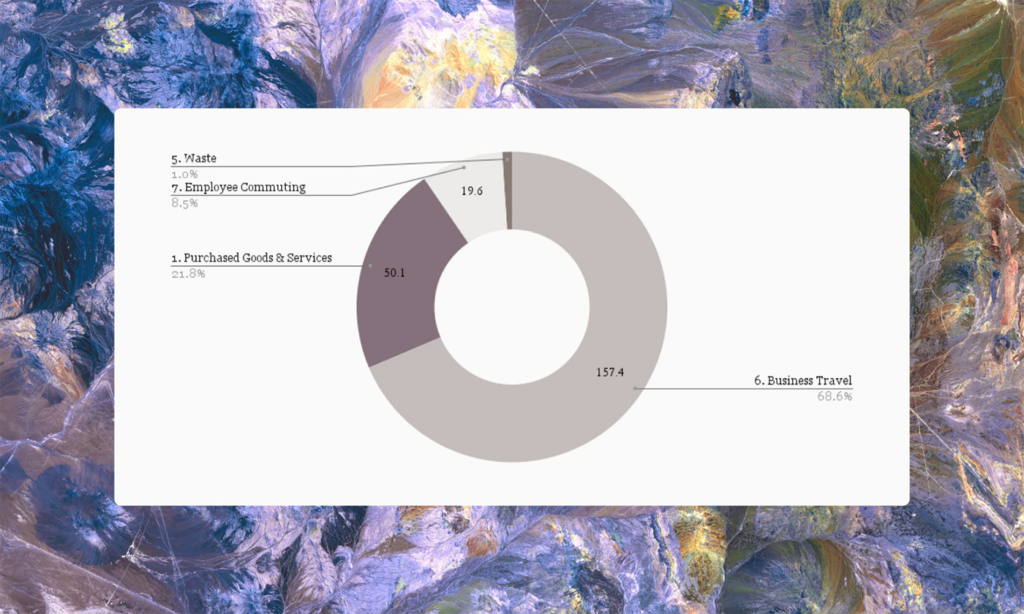
In 2023, NZero’s Scope 1 emissions were 5 MTCO2e, Scope 2 emissions were 9 MTCO2e, and Scope 3 emissions were 229 MTCO2e, for a total of 243 MTCO2e. Notably, Scope 3 emissions make up over 94% of the total emissions, stemming from Business Travel (65%), Purchased Goods and Services (20%), Employee Commuting (8%) and Waste (1%).
A detailed examination of Scope 3 reveals that Commercial Flights are the single most significant contributor to Scope 3 emissions, accounting for nearly 61% of business travel emissions and nearly 40% of our total emissions. Emissions from Taxi Services, Rental Vehicles and Personal Vehicles were the second largest Scope 3 contributor, emitting over 36 MTCO2e – 15% of total emissions. Emissions from Hotel Accommodations were the third largest single source of emissions at 23 MTCO2e, about 9.5% of total emissions. Another significant source of emissions was Purchased Goods and Services, particularly food and drink, which contributed 22.3 MTCO2e – 9% of total emissions. Combined, Employee Commuting, Business Travel and Hotels, and Food & Drink purchases made up over 80% of the company’s total 2023 emissions.
Figure 1. 2023 Emissions Summary by Scope
Greenhouse Gas Emissions
Table 1. GHG Emissions by Scope
Scope 3 Breakdown
Scope 3 categories identified as material and relevant to our business in 2023 include Purchased Goods and Services, Waste Generated in Operations, Business Travel, and Employee Commuting. Scope 3 made up over 94% of NZero’s total 2023 emissions with the top source of emissions being Business Travel, specifically flights which made up 61% of Scope 3 emissions and 40% of total company emissions in 2023. The next largest contributors were Taxis, Personal & Rental Vehicles (Business Travel), Hotel Accommodations (Business Travel) and Food and Drinks (Purchased Goods and Services) contributing 15%, 10%, and 9% to total emissions, respectively. Employee Commuting was also a significant contributor to company emissions in 2023 emitting nearly 20 MTCO2e, about 8% of company emissions in 2023.
Figure 3. Scope 3 Emissions by Scope 3 Category
Purchased Goods & Services
Purchased Goods and Services was the second largest source of Scope 3 emissions, emitting a total of 50 MTCO2e and accounting for almost 22% of Scope 3 emissions. Food & drink purchases was the most significant contributor, accounting for 22 MTCO2e – nearly 45% of emissions within this category. The next largest emitters were software purchases, office supplies and electronics, and healthcare at 7.6 MTCO2e, 6.7 MTCO2e, and 4.9 MTCO2e, respectively. Zoom meetings contributed only 6% to emissions within this Scope 3 category, however emissions vary depending on video setting assumptions used in calculations. Taking into consideration NZero’s company culture which favors video conferencing over audio to improve communication, build relationships and enhance productivity, calculations were done under the assumption that video cameras were turned on 80% of the time. Cameras turned on 80% of the time led to a 19% reduction in emissions compared to if cameras had been turned on 100% of the time. However, with video completely off 100% of the time, emissions would have been reduced by 96% compared to if video was always on, and would have resulted in avoiding over 3 MTCO2e.
Business Travel
Business Travel was the largest Scope 3 emitter, making up nearly 69% of all Scope 3 emissions at 157 MTCO2e. Within this category, commercial airline flights made up the majority of these emissions, contributing 61% to this Scope 3 category and 42% to emissions overall. Taxi, personal vehicles, and rental vehicles was the next largest source of business travel emissions at 36 MTCO2e, while hotel stays and trains and buses rounded out this category, contributing 23 MTCO2e and 1 MTCO2e, respectively.
Figure 4. Business Travel Emissions Breakdown
Waste
Waste was the smallest of all Scope 3 categories, emitting a total of 2.3 MTCO2e in 2023, less than 1% of the total emissions. Waste generated from employees working from home made up the majority of waste emissions at over 85%, while the waste generated at NZero HQ made up only 15%. Some sustainable practices that contributed to reducing waste at NZero HQ include implementing recycling in 2023, as well as donating any excess food to avoid food waste. Being an environmentally conscious company, NZero also encourages employees to minimize the amount of waste they produce from their home offices, as well as compost and recycle as much as possible.
Employee Commuting
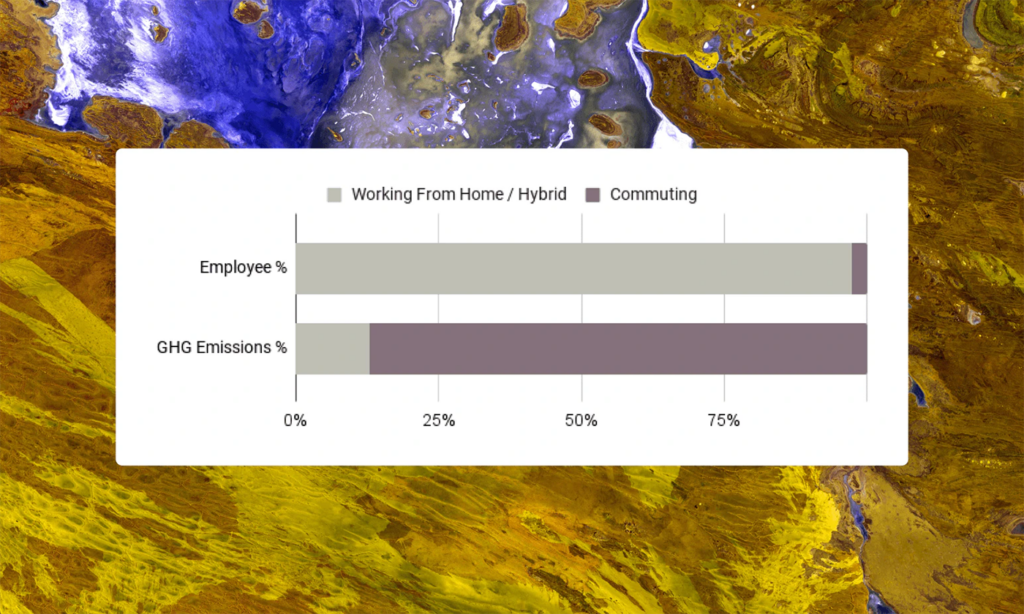
Emissions from Employee Commuting were also small, with 17 MTCO2e coming from physical commuting, and less than 3 MTCO2e from work from home emissions, for a total of about 20 MTCO2e. This made up about 9% of total emissions in 2023.
Based on the NZero Employee survey results which received about a 63% response rate, about 46% of NZero employees commute to work at least once a week. Of these commuters, employees on average commute a little under two days per week to the office.
Because nearly all of NZero’s workforce is either hybrid or fully remote, work from home emissions were critical to capture and include in this category.
Data such as square footage, type of residence, zip code, and home heating methods was collected through the survey, and energy use and emissions from employee’s home offices were modeled based on data from ResStock.
Work from home emissions were modeled using data on employee home offices collected via the NZero employee survey. Emissions were allocated to the time period employees were working at the company. Although 97% of employees in 2023 worked either completely remotely or a mix of in office and at home, the emissions generated from remote work were only 13% of this category’s emissions, while the physical commuting made up the other 87%, highlighting the emission reduction benefits of work from home policies and the significant impact physical commuting has on emissions.
Figure 5. Employee Remote vs Commuter Emissions
Looking Ahead
At just under 4%, Scope 2 contributed a relatively small amount to NZero’s total emissions. For its calculation, we were eager to employ NZero’s advanced grid study methodology that takes into account hourly variations of the Grid’s carbon intensity to achieve greater accuracy and granularity. The use of granular emission factors gives us greater insight into our emissions at a daily and even hourly level, allowing us to pinpoint decarbonization opportunities and craft more tailored solutions to reducing emissions.
Another unique aspect of our GHG inventory is our innovative methodology for calculating work from home emissions. With the rise in remote workers in recent years, and the prevalence of remote or hybrid workers in NZero’s workforce, these emissions were particularly important to capture. Although they make up just 1% of NZero’s total emissions, 97% percent of employees worked remotely or in a hybrid fashion in 2023. Had 100% of employees commuted to work in 2023, employee commuting emissions would have increased from 2.5 MTCO2e to over 57 MTCO2e, equivalent to ~20% of NZero’s total emissions.
The successful development and implementation of a geographically-aware gradient-boosted regression tree model, supported by key survey questions and 24/7 carbon intensities, have provided a nuanced approach to estimate the carbon emissions associated with employees’ remote work for NZero. The methodology’s attention to details, including the integration of specific household features, hourly weather data, and the critical differentiation between varying occupancy levels, has enabled a comprehensive and context-sensitive evaluation of the company’s Scope 3 carbon footprint. The model’s ability to quantify the marginal energy usage due to an employee’s presence in the residence has added a further dimension to understanding the environmental impact of work-from-home policies.
The utilization of NZero’s hourly carbon intensity data, combined with standardized conversion methods for natural gas estimates, ensured the precision and reliability of the final greenhouse gas usage intensity (GUI) calculations. By incorporating these various elements, the study successfully provided an innovative approach to evaluate and understand the direct environmental consequences of remote work. This methodology can serve as a replicable framework for companies seeking to assess and mitigate their environmental impact in an increasingly remote and digital work landscape.
NZero’s work from home policies play a pivotal role in reducing the need for daily commutes, thereby eliminating potential emissions. NZero will continue allowing employees to work from home when in-person collaboration isn’t necessary, and encourage employees to use low or zero emission transportation methods when they do need to come into the office. With flights accounting for nearly 40% of company emissions in 2023, NZero will seek to reduce the number of flights taken in the future, and use a less emission intensive method of transportation whenever possible.
Acknowledging the substantial impact of Scope 3, NZero is committed to refining its emission tracking and reduction strategies, focusing on adopting activity-based and supplier-specific emission factors and developing specific Scope 3 emission factors through Life Cycle Assessments (LCAs). As business travel was the largest emitter in 2023, it is a focus for NZero on its decarbonization journey. NZero has restricted commercial flights to specific airlines to better track air travel, provide greater transparency internally around number business flights and improve emission calculation accuracy going forward. To reduce emissions, NZero has also established best practices to encourage employees to take alternative methods of transportation besides flights whenever possible. Additionally NZero has sought to actively minimize the need for business trips requiring flights, allowing employees to work remotely for the large majority of the time, and only requiring in-person meet-ups when strictly necessary.
We look forward to continuing to provide our customers with accurate and reliable data, using innovative GHG emission calculation methodologies in Scope 2 and modeling work from home emissions to help organizations more accurately and confidently calculate their emissions and identify more effective ways to reduce emissions and increase the rate of decarbonization.
Scope 1 emissions came from natural gas combustion at NZero’s headquarters in Reno, Nevada. NZero leases an office space in downtown Reno and receives utility bills from the landlord which were used to measure how much natural gas was used. The emission factor for natural gas was sourced from EPA’s Emission Factors for GHG Inventories (September 2023).
Scope 2
Scope 2 emissions in 2023 came from purchased electricity at NZero’s headquarters based in Reno, Nevada. NZero employs an advanced grid study to calculate Scope 2 emissions, which takes into account the seasonal, daily and hourly variation in location-based emission factors to provide a more accurate and detailed measurement of Scope 2 emissions.
The grid study uses facility-specific and resource-specific data that is matched to actual generation dispatch and linked to the time of consumption, which results in a more comprehensive and precise measurement than using an annual grid average emission factor (e.g. EPA eGRID dataset). NZero’s hourly emission factors account for local variability in the actual electricity generation on an hourly basis. The data used in the study is available to the public and comes from sources such as balancing authority data, plant information, and thermal plant generation data published by organizations like the Environmental Protection Agency (EPA), Energy Information Administration (EIA), and International Energy Agency (IEA). NZero’s automated emissions modeling system aggregates these data sources to accurately model hourly emissions factors. NZero’s Scope 2 methodology provides the highest level of precision for Scope 2 carbon accounting while ensuring adherence to the GHG Protocol Scope 2 Guidance.
NZero HQ does not have AMI submeters on site to collect hourly electricity consumption data, so data was collected from monthly utility bills. Since monthly bill readings were the most granular data available, the hourly carbon intensity of the grid in Reno for each month of 2023 was averaged and matched to NZero’s monthly electricity consumption to calculate emissions.
This category includes all Purchased Goods and Services that were tracked through our procurement system, where all items purchased for company purposes are recorded. Emissions were calculated using EPA’s Supply Chain GHG Emission Factors for the U.S. Industries and Commodities report which provides emission factors that cover all categories of goods and services in the US economy. Major items within this category include emissions from NZero’s Cloud Storage, Zoom usage, Food and Drink, Office Supplies and Electronics, Software Subscriptions, Healthcare Expenditures, Co-working Spaces rented by NZero, and other miscellaneous goods & services. NZero uses Amazon Web Services (AWS) for cloud storage and emissions data was retrieved directly from the AWS website.
Research has shown that there is a large variance in emissions when video cameras are turned on compared to when they are turned off (Obringer et al., 2021). As such, Zoom meetings emissions were calculated using an emission factor taking into consideration both the duration of the meeting and its video setting.
Two sources of waste data were included for 2023. The first was waste from NZero’s HQ, where data was collected on the amount of garbage being thrown out each week. The volume of waste was converted to weight using EPA’s Volume-to-Weight Conversion Factors.
The second source of data was from NZero’s Employee Survey where employees were asked about their work from home behaviors and how much paper, plastic, aluminum, glass, and food waste they generated while working from home during work hours. Data was also collected on the disposal method for each type of waste.
About 63% of employees responded to the survey and data was extrapolated to capture the footprint of the entire company. Emission factors for waste were sourced from EPA’s Emission Factors for Greenhouse Gas Inventories (September 2023).
This category includes emissions from flights, taxi services including Uber and Lyft, public transportation, rental cars, and personal vehicles used for business purposes. Emissions from hotel accommodations during business trips were also included in this category. All business travel data was tracked and collected through NZero’s procurement system, or via company-wide airline reports.
All emissions in this category except for emissions from personal vehicles and flights captured in the airline reports were calculated using spend based emission factors (CO2e/$) from EPA’s Supply Chain GHG Emission Factors for U.S. Industries and Commodities. For commercial air travel, the departure airport and arrival airports were extracted from the airline reports and distances between airports were calculated using the great circle distance (GCD) plus a route variance factor of 5%. The factor was calculated from the variations between the GCD and actual flight paths pulled via an API. Flights were categorized into short, medium and long haul flights with a distance-based emission factor being applied to each flight distance. For flights not captured in the airline reports, a spend based factor was used. For personal vehicles, it was assumed that the amount of fuel purchased was the amount of fuel used, and that all vehicles used regular motor gasoline. The amount spent on gasoline was converted into gallons of motor gasoline using the US average 2023 price for gasoline, and a fuel-based emission factor from the EPA was applied. The Climate Registry’s factors for estimating CH4 & N2O emissions from gasoline and diesel vehicles were used to account for CH4 & N2O emissions from personal vehicles.
Category 7: Employee Commuting
This category includes emissions from all employees, contractors and interns commuting to and from work, as well as emissions from people working from home offices. Data on employee commuting patterns, including mode of transportation, distance traveled, and vehicle make, model, year, and fuel economy, was also captured via NZero’s Employee Survey and emissions were calculated using a fuel-based emission factor for CO2, and a mileage-based emission factor for CH4 and N2O. Fuel usage was estimated based on the reported fuel economy of employee vehicles used for commuting and the distance traveled. Emissions were also adjusted for employees joining and leaving the company mid-year and extrapolated to employees who did not respond to the survey. Emission factors were sourced from the EPA’s Emission Factors for GHG Inventories (September 2023).
The integration of hourly carbon intensities allowed for a comprehensive understanding of the GHG emissions associated with remote work. Using the ResStock TMY3 2022 dataset sourced from the National Renewable Energy Laboratory (NREL), NZero’s data science team employed the open-source CatBoost software and built a geographically-aware gradient-boosted regression tree model that predicted hourly electric and gas Energy Use Intensity (EUI) on the basis of local weather data from WeatherAPI and various residence input features, which was then used to calculate emissions based on home sizes retrieved from the NZero Employee Survey. Emissions were attributed to each employee based on their work-from-home hours and the timeframe for which they were employed at NZero during 2023. To define the usage difference attributable to the employer’s Scope 3, we incorporated a marginal energy usage attributable to the counterfactual presence of each employee in their residence
Emissions were extrapolated to employees who did not take the survey or opted out of the survey by using the data collected from survey respondents to create an average NZero employee emission profile for an employee who worked at NZero all of 2023, and then attributing emissions appropriately to the timeframe all non-respondents worked at NZero during 2023.
For sustainability leaders, by
sustainability leaders.